
Charting options with Fable, VueJs and NVD3
I have been playing with options, their pricing and pay-off charts generation for some time now. I have created a small F# library called Pricer which does options pricing and few other things. In order to demonstrate what the library can do, I wanted to create a small web application. First I went for standard JavaScript client with F# backend, but then I came across Fable and at the end created payoffcharts.com. This small application contains different visualizations of options, payoffs and their prices - and yeah it’s all F#.
I have previously written an introduction into Fable, D3 and NVD3 charting. Check it out for the charting part. The rest of this post is structured as follows:
- Introduction into options, their parameters
- Domain model describing options
- Generating charts with NVD3
- Using VueJs with Fable to create a single page application
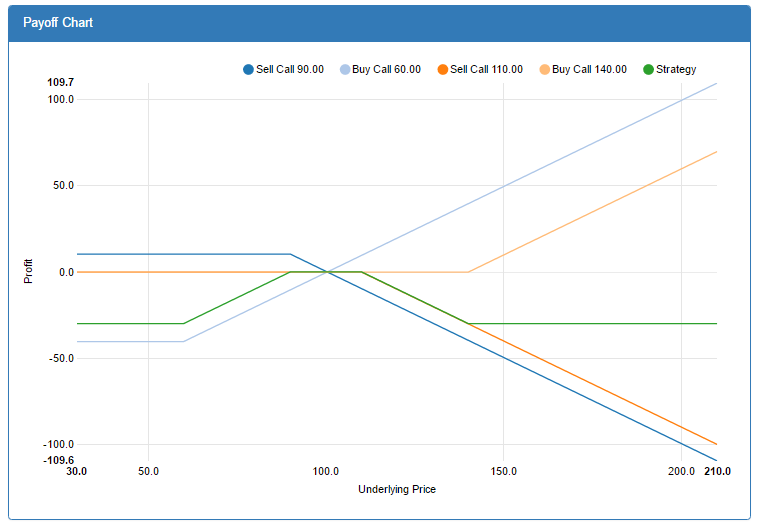
Payoff charts of several strategies, such as the following Condor.
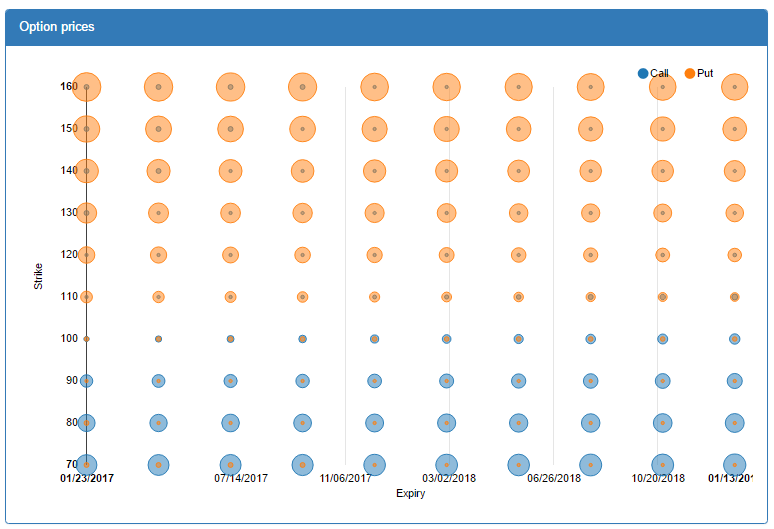
Using bubble chart to compare option prices depending on strike and expiry
Payoff charts
A bit of theory is necessary here, just to describe the domain: options and strategies. Options are financial contracts that give you the right to buy some asset in the future for agreed price. The code that I will describe in few following paragraphs is part of the Pricer library.
Call and Put Options
- Call is the right to buy the stock for agreed price
- Put is the right to sell the stock for agreed price
- Option parameters:
- Underlying (stock or commodity)
- Strike
- Expiry
- Type (Put/Call)
- Style (American/European)
- Premium (the price)
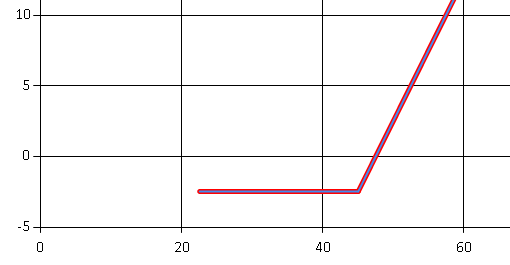
Payoff chart, shows us how much we earn when the stock moves up or down. Bellow is the payoff chart of Call option with strike 45, Premium: 2.5.
Strategies
- Traders can buy or sell multiple options in the same time
- Multiple options bought at the same time make up strategies
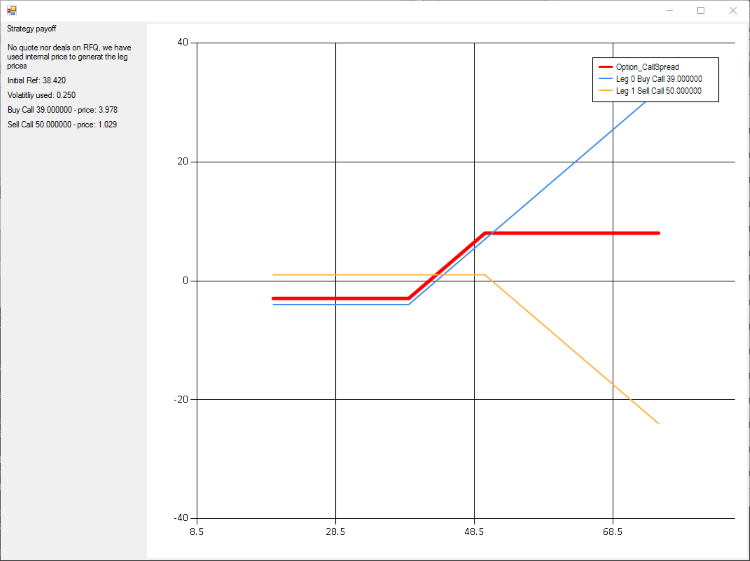
- Example of such strategy can be a Call Spread
- Buying a call
- Selling a call with higher strike
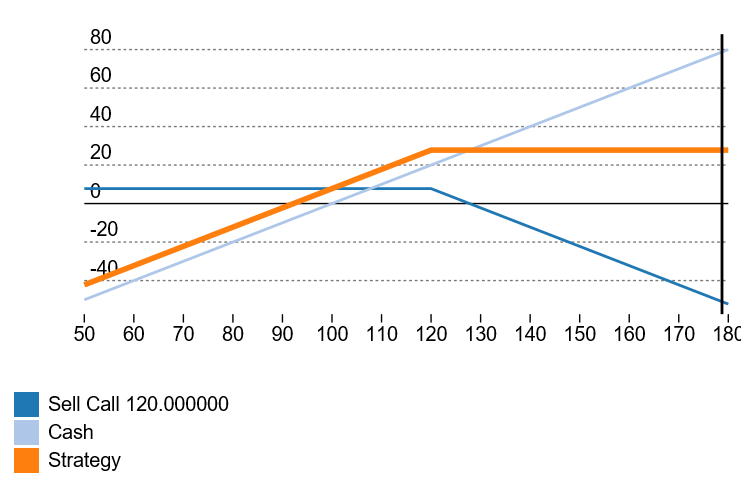
Another example of a strategy: Covered Call
- Strategy built of a cash leg and an option leg
- I bought the stock at 100 and I want to sell at 120
- Let’s profit a bit and sell a call option with strike 120
In order to generate the charts, we will need to defined the domain model. All this is part of the Pricer library and I have simplified it for this blog a bit. When we build a strategy, each part of the strategy (options, or stock) is called leg. As said, leg can be either option or cash (stock). Let’s define the options leg first:
type OptionKind =
  | Call
  | Put

type OptionStyle =
  | American
  | European

type OptionLeg = {
    Direction : float
    Strike : float
    Expiry : DateTime
    Kind : OptionKind
    Style: OptionStyle
    PurchaseDate: DateTime
  }
  member this.TimeToExpiry = this.Expiry - this.PurchaseDate
Besides an Option leg we will also define a Cash leg. Cash leg is just a different name for holding stock or commodity or any other underlying directly. One can compose a strategy by holding a stock and an option on the same stock in the same time. We will show later what this could be used for. Cash leg has just a price at which we have bought are at which we are selling the stock.
type CashLeg = {
  Direction: float
  Price:float
}
We can now compose both legs into a single type.
type LegInfo =
  | Cash of CashLeg
  | Option of OptionLeg
Each leg (option or cash) will have a price. For options the price is usually called the premium, it is wrapped by a type here to simplify further development.
type Pricing = {
  Premium: float
}

type Leg = {
  Definition:LegInfo
  Pricing:Pricing option
}
We also need a type to specify the underlying (share, commodity) on which the options are defined and a Strategy type to wrap it all.
type StockInfo = {
  Rate:float
  Volatility: float
  CurrentPrice: float
}

type Strategy = {
  Stock : StockInfo
  Name : String
  Legs: Leg list
}
Now that we have the model, let’s actually use it to create an example of a strategy. We will use the Covered Call as our example.
let buyingCash = {
	Definition = Cash {
		Price = 100.0
		Direction = 1.0
	}
	Pricing = Some {
		Premium: 100.0
	}
}

let sellingCall = {
    Definition = Option {
      Direction = -1.0
      Strike = 120.0
      Expiry = new DateTime(2017,1,1)
      Kind = Call
      Style = European
      PurchaseDate = DateTime.Now
  }
  Pricing = Some {
		Premium: 10.0
	}
}

let coveredCall = {
  Name = "Covered Call"
  Legs = [
        buyingCash
        sellingCall
    ]
  Stock =
    {
      CurrentPrice = 100.0
      Volatility = 0.20
      Rate = 0.01
    }
}
Now let’s see how we can generate the payoff chart from the coveredCall variable. We will put aside the pricing of options, let’s assume that we already have the prices (the are stored in the Pricing variable of each leg). How can we generate the payoff chart of any strategy?
Chart is just a composition of lines connecting X,Y coordinates, the Y coordinate reflects the value of the option. The value of the option is not the premium, but expresses how much I can earn if I exercise the option now.
In other words, how much do we earn if we exercise the option, when the underlying share is at certain given level?
let optionValue option stockPrice =
	match option.Kind with
		| Call -> max 0.0 (stockPrice - option.Strike)
		| Put -> max 0.0 (option.Strike - stockPrice)
The following picture shows a detail of the Call payoff chart. We have defined a function to computed the black line.
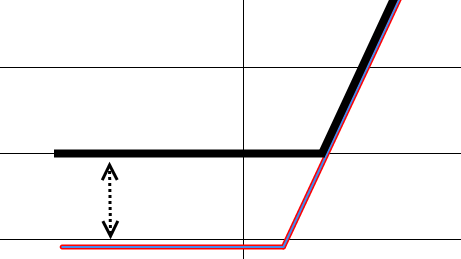
Up to this point we actually didn’t take into account the price of the options, we have assumed, that we already had it. Next question is: What is the payoff of an option? When calculating the payoff we take into account the premium of the option (the money that we paid to obtain the option).
let legPayoff leg pricing stockPrice =
	match leg with
		| Cash cashLeg -> stockPrice - cashLeg.Price
		| Option optionLeg -> optionValue optionLeg stockPrice - pricing.Premium
This function calculates the violet line from the previous picture.
Sampling the data
- In order to chart the data, we will need to generate X,Y pairs
- What are the interesting points on X axis?
- Basically the chart can change only on the strikes of each option leg in the strategy
let getInterestingPoints strategy =
	let strikes = strategy.Legs |> List.map (fun leg ->
			match leg.Definition with
				| Cash cashLeg -> cashLeg.Price
				| Option optionLeg -> optionLeg.Strike
		)
		let min = 0.5*(strikes |> Seq.min)
		let max = 1.5*(strikes |> Seq.max)
		seq {
			yield min
			yield! strikes
			yield max
		}
If we have all the interesting X points, we can now compute the option lines (one line per each leg). The following function will return a list of functions. Each function will be a payoff calculator which takes X will and returns Y payoff value of the option.
let payOffs = strategy.Legs |> Seq.map (fun leg ->
    let legPricing =
		  match leg.Pricing with
              | Some pricing -> pricing
              | None -> getLegPricing strategy.Stock leg

    let pricedLeg = { leg with Pricing = Some legPricing }
    legPayoff pricedLeg.Definition legPricing
)
Now let’s get the actual values for all the interesting points on the X axis:
let interestingPoints = getInterestingPoints strategy
let legLinesData =
	payOffs |> Seq.map (fun payoff ->
		[for stockPrice in interestingPoints -> stockPrice, payOff stockPrice]
	)
So far we have calculated the values for all the legs, but not yet the actual strategy payoff line. The strategy payoff is just a sum of all the line payoffs.
let strategyLine = [for stockPrice in interestingPoints do yield stockPrice,
	payOffs |> Seq.sumBy (fun payOff -> payOff stockPrice)
]
Example strategies
As it has been shown, we can combine the options together in infinite ways and create our own custom strategies. On the other hand there are multiple strategies that are well known, usable for certain situations. The Covered Call strategy mentioned above is one of such examples. I have put together a short list of such strategies and included them into Pricer. The full list is available in StrategiesExamples file. Let’s see one more example here, the Straddle:
let straddle stock =
    let strike,_ = testStrikes stock
    {
        Name = "Straddle"
        Legs = [
                buildOptionLeg 1.0 strike expiry Call
                buildOptionLeg 1.0 strike expiry Put
        ]
        Stock = stock
    }
Note that this is using some helper methods do get the correct strike (around the underlying) and build the legs. Similar methods are defined for other strategies and one can get them all at once as well.
Charting with NVD3
I have already written an introduction post to charting with Fable, NVD3 and D3 and there is not much more to it. Quick summary:
- Add D3 and NVD3 as npm dependencies
- Import the D3 fable bindings
- Write custom bindings for NVD3
- Draw your chart just like if you would be writing JavaScript code
Using Vue.js
I have decided to use vue.js as JavaScript framework to wire up the logic behind the view, mainly for two reasons:
- Previous version of my application was F# server, and JavaScript client based on KnockoutJS. The was VueJS works resembles a lot to knockout and makes the transition easy.
- I wanted a framework that would already work with Fable. An example using VueJs (standard Todo MVC app) is available in Fable’s repo:
VueJs supports two-way binding and let’s you define your view in html files. So unlike React the views are specified in HTML files. Behinds the curtains VueJs is creating virtual DOM as React would do. Unlike KnockoutJs where you would need special observable properties, VueJs let’s you bind directly on plain JavaScript objects. The binding syntax is quite straightforward. As an example let’s look at the strategies list on the left panel:
<ul>
    <li v-for="strategy in strategies">
        <a href="#" v-on:click="select(strategy)"></a>
    </li>
</ul>
We are using special v-for binding which will render the template for each element in the list. For each strategy we will just show the name for the strategy and we are using v-on:click binding to invoke the select method of the ViewModel, passing it the strategy itself.
The ViewModel behind this view, needs the strategy list and the select method:
type StrategyListViewModel(examples) =
        let mutable strategies = examples |> List.map (fun s -> new StrategyViewModel(s)) |> Array.ofList
        let mutable selectedStrategy: StrategyViewModel option = None

        member x.select strat =
            selectedStrategy <- Some strat
            selectedStrategy.Value.generatePayoff()
The strategy list takes the list of strategies, wraps each of them as ViewModel and stores them in it’s local list. Let’s look at the strategy because that is really the ViewModel that holds the majority of the code:
type StrategyViewModel(strategy) =
		let mutable legs = strategy.Legs |> List.map (fun l -> LegViewModel(l)) |> Array.ofList
		let mutable name = strategy.Name
		let mutable stock = new StockViewModel(strategy.Stock)

		member __.addLeg(event) =
				let  newLeg: Leg = {
						Definition = Option {
								Direction = 1.0
								Strike = 100.0
								Expiry = DateTime.Now
								Kind = Call
								Style = European
								PurchaseDate = DateTime.Now
						}
						Pricing = None
				}

				legs <- (legs |> Array.append [|new LegViewModel(newLeg)|])

		member __.removeLeg(leg:LegViewModel) =
				legs <- (legs |> Array.filter (fun l -> l.getLeg <> leg.getLeg))

		member __.generatePayoff() =
				let newStrategy = {
						Name = name
						Legs = legs |> Seq.map (fun l -> l.getLeg) |> List.ofSeq
						Stock = stock.buildStock
				}
				let data = payoffsGenerator.getStrategyData newStrategy
				Charting.drawPayoff data "#payoffChart"
Each strategy has few things:
- List of legs (each of them is wrapped by LegViewModel).
- Method to add a new leg into the list
- Method to remove a leg from a list
- Method to generate a payoff chart
In order to make Vue and F# play nice together I had to make few variables mutable. That makes since because any view model is mutable by it’s definition. Having immutable objects behind your UI might be possible, but one would have to go for Redux or similar “single flow” solution and basically give up two-way binding. So don’t judge me for adding those mutable fields.
Adding a new leg means creating new leg object, wrapping it by the ViewModel and mutating the original list of legs.
Issues while using VueJs from F#
There are few issues that you might encounter, while using Fable & Vue, mainly because both are still quite young and evolve.
Only arrays are observed
It seems that currently only arrays are observed by Vue.js correctly as collections. For instance in my case each strategy has a list of legs that I expose as a member (using F# list this time).
type StrategyViewModel(strat) =
       let mutable strategy: Strategy = strat
       member __.legs = strategy.Legs |> List.map (fun l -> LegViewModel(l))
This works the first time just for rendering, but as soon as you modify the original strategy mutable field and add or remove leg, nothing happens. In order to force Vue.js to observe the list, one has to cast it to array:
member __.legs = strategy.Legs |> List.map (fun l -> LegViewModel(l)) |> Array.ofList
Input bound values have to be string
All the values that are bound to form inputs have to be string. For that reason I had to introduce mutable string variables (which is really horrible way of doing things). I would love to have my LegViewModel defined just like this:
type LegViewModel(l:Leg) =
    let mutable leg = l
    let mutable strike = l.strike
If you don’t specify the type of strike the compiler will infer it to float, based on it’s usage, however since this is bounded input field, one will actually get string on run-time.
Fable non supported methods
Fable just can’t compile the whole BCL to JavaScript, even though it tries and succeeds very often. I have stumbled over the following:
- Cannot find replacement for sign - One could very easily emit it’s own JavaScript to solve this one.
- Cannot find replacement for System.DateTime.toString - This would be very complicated, since there are so many overloads of this method. I guess the right thing would be to use Moment JavaScript library and just write Fable bindings for it.
- Cannot find replacement for System.Int32.parse - One can actually use int function instead of Int32.parse.
Summary
Overall this was quite nice experience. Even though Fable is quite new I was able to tweak the VueJs example that is part of the Github repository to create pretty cool application.