
Vehicle Routing Problem
One of my school assignments this semester was to implement some of the algorithms which solve the Vehicle Routing Problem.
UPDATE: I have moved the source code to GitHub
In VRP you have a depot and a set of customers. You have a fleet of vehicles which can serve this customers. Each customer can have an exact demand on quantity of goods and each vehicle can have capacity which is able to serve. This is easily modeled as Graph Theory Problem. The problem is NP hard. However there are several algorithms described for this problem (heuristics, genetic algorithms). To know more about variants and different solutions check this source.
I decided to implement Clarks & Wrights and Sweep algorithm. I build my solution in JAVA but later I decided that it would be cool to have some way to visualize the results. Then I decided to use GWT-MAPS API to visualize real world problems. Soon I wanted also to visualize the random generated graph problems so I included the GWT-INCUBATOR API to show some small graphs.
Basic functions
- Compute the routes using Clark & Wright or Sweep algorithm
- Generate random VRP - including distance matrix, node positions and demands of each node
- Compute distance matrix from real world data using Google MAPS API
Basic usage
The input for this utility to compute the vehicle rows has to be specified as follows:
[route count] [distance matrix] [customer demand;address;x coordinate;y coordinate]
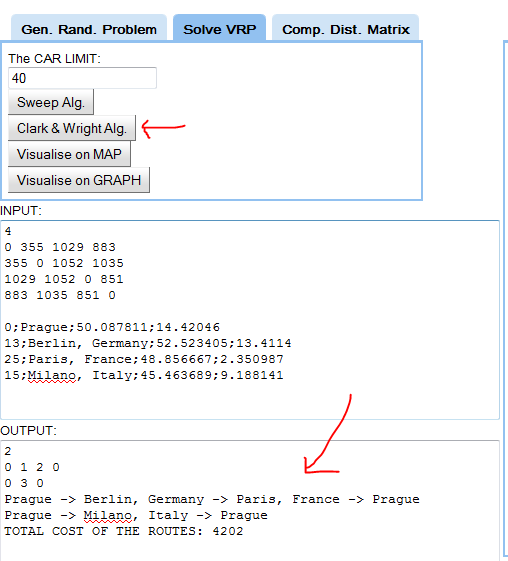
After loading the site you can see example problem of 3 customers. You can run Clark & Wright or Sweep algorithm and you will obtained the routes of the VRP in the OUTPUT window. Before running the algorithm you should set the capacity of the vehicles - in this situation all the vehicles have the same capacity. The output has the following format:
[number of routes] [depo city1 city2 … cityN depo] … [depo->city1->city2 … cityN->depo] …
You can visualize the output either on Graph or on MAP - if you working with real world cities and addresses than you visualize on map. If you are working just with sample data the you can visualize on the graph.
Generating distance matrix for real world cities
To generate the distance for several cities for which you know only the addresses u will enter in the INPUT box on each line one city and then click on “Generate distance matrix”. Also you can see that on the MAP tab all the routes network connecting all the cities has been visualized:

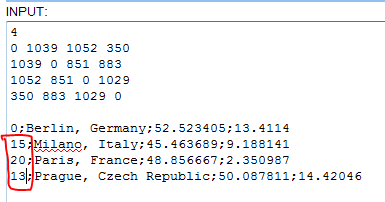
Now you need to modify the input - more specifically modify the amounts of goods requested by each city. The DEPOT is always in the first city, so there the demand would be zero. Let’s say your customer in Milano wants 15 units, in Paris 20 units and in Prague 13 units.
Now again you can just run the desired algorithm and view the results. For example after running the Clark & Wright algorithm you should get the following output:

Now you can visualize these routes in the MAP.

Generating and visualizing random problem
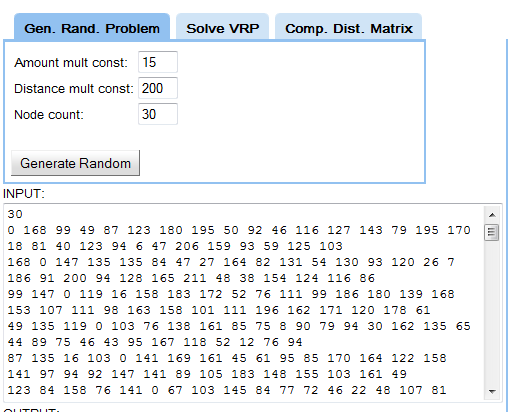
To generate random GRAPH VPR Problem you have to specify:
- Number of nodes.
- Constant by which the random value(0-1) would be multiplied to obtain desired amount for each city.
- Constant by which the random value(0-1) would be multiplied to obtain random coordinates of the city.
After you will obtain the desired INPUT.
Now you can run one of the algorithms(eg. SWEEP) and you will obtain the OUTPUT - the routes of the vehicle.
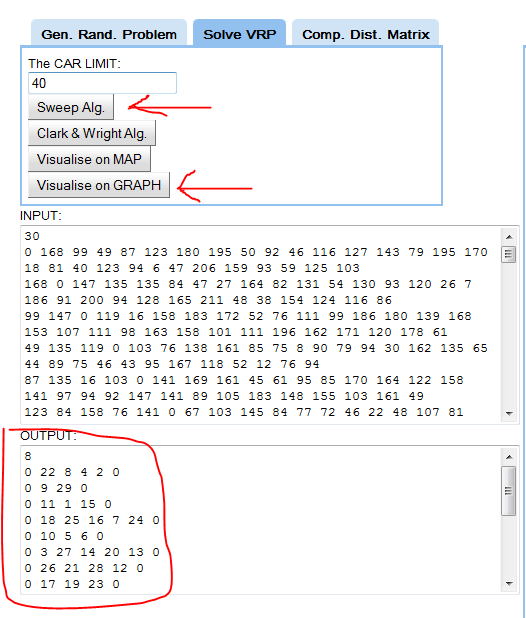
Now because this is randomly generated problem it is good to visualize it in the GRAPH:

Current issues
The clear method of the canvas to visualize the points is not working fine - generating new VRP problem will not erase the points of the old VRP problem. The main issue is that this application uses the GWT Canvas, which was a part of GWT incubator. It also uses the Google Maps binding for GWT.
Since I have wrote the application there have been several changes in the situation about GWT and plugins:
- Canvas is now part of the GWT 3. So theoretically the application could be rewritten using GWT 3.
- Google Maps are now in version 2. However the GWT binding for Maps v3 has not yet been released – there are however some open-source initiatives.
So what to do now? I have kept the code as it is: using maps v2 and the ancient Canvas project. If anyone feels motivated for moving the application to GWT 3 (changing Canvas and Maps binding) just fork it away on GitHub.
About the source code
The source code is available on GitHub . It contains two parts:
- Java-only package. That is a basic library and executable program which can solve the VRP without the visualization.
- GWT packages. Contains the classes which perform the VRP solving and the visualization using GWT.
The classes from the Java-only package are copied to the GWT project. That is because they have to be presented at compile time – the classes cannot be included as a JAR file. If anyone knows how to reuse a code in GWT projects without doubling it – let me know.
The code is of a very poor quality. At time when I have wrote it I simply did not care about the readability and also I did not know Java that well.